Do you need to get a visual overview of the company’s key figures? Then you may need to investigate Power BI and how it can help you. Power BI can give you a visual overview using graphs and reports. It can be used to get an overall view of the company’s key figures but can also be used to dive further into the numbers, such as for a department or similar.
If you do not feel equipped to start preparing reports yourself etc., we can help you set up a document that gives you the ideal overview.
Do you need help to create a Power BI dashboard? We are at your service. Contact Therese Stigfeldt on mail: ts@frontiot.com
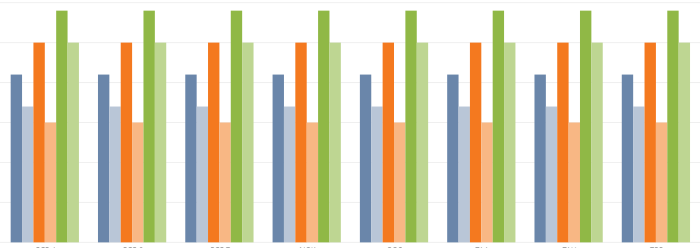
Example of graph with comparisson of budget and realised numbers